How do the new environmental prices affect your barometer?
The new environmental awards that CE Delft published in 2023 have been implemented in the Environmental Barometer. This may mean that there may be some shifts in the graphs in your organization’s barometer.

What does the update of environmental prices do to your environmental graph?
We would like to explain this further in this article and show what the most important shifts are. In another article we tell you more about what environmental prices are and why they are periodically adjusted.
Environmental prices change due to new scientific insights and social developments. The new environmental prices will be implemented retroactively for all years. If we were to calculate with the old environmental prices for old years, 2024 would show a huge jump in the environmental graph, which mainly reflects the inflation of six years.
Difference between emission figures and environmental prices
In addition to environmental prices changing, emission figures from business activities also change over the years. This may be due to stricter emission requirements, developments in technology or a different fuel composition. New emission figures are calculated annually for some business activities, such as electricity. But for many business activities this only happens once every four to five years, as in the Stream freight transport and Stream passenger transport studies.
We process these changes in emission figures in the annual update of the environmental factors. For example, the environmental factor of a kWh of electricity in 2022 is different from that of 2018 because the electricity mix differs in those years.
But how do environmental factors come about? And how do these translate into an environmental score?
Environmental factors
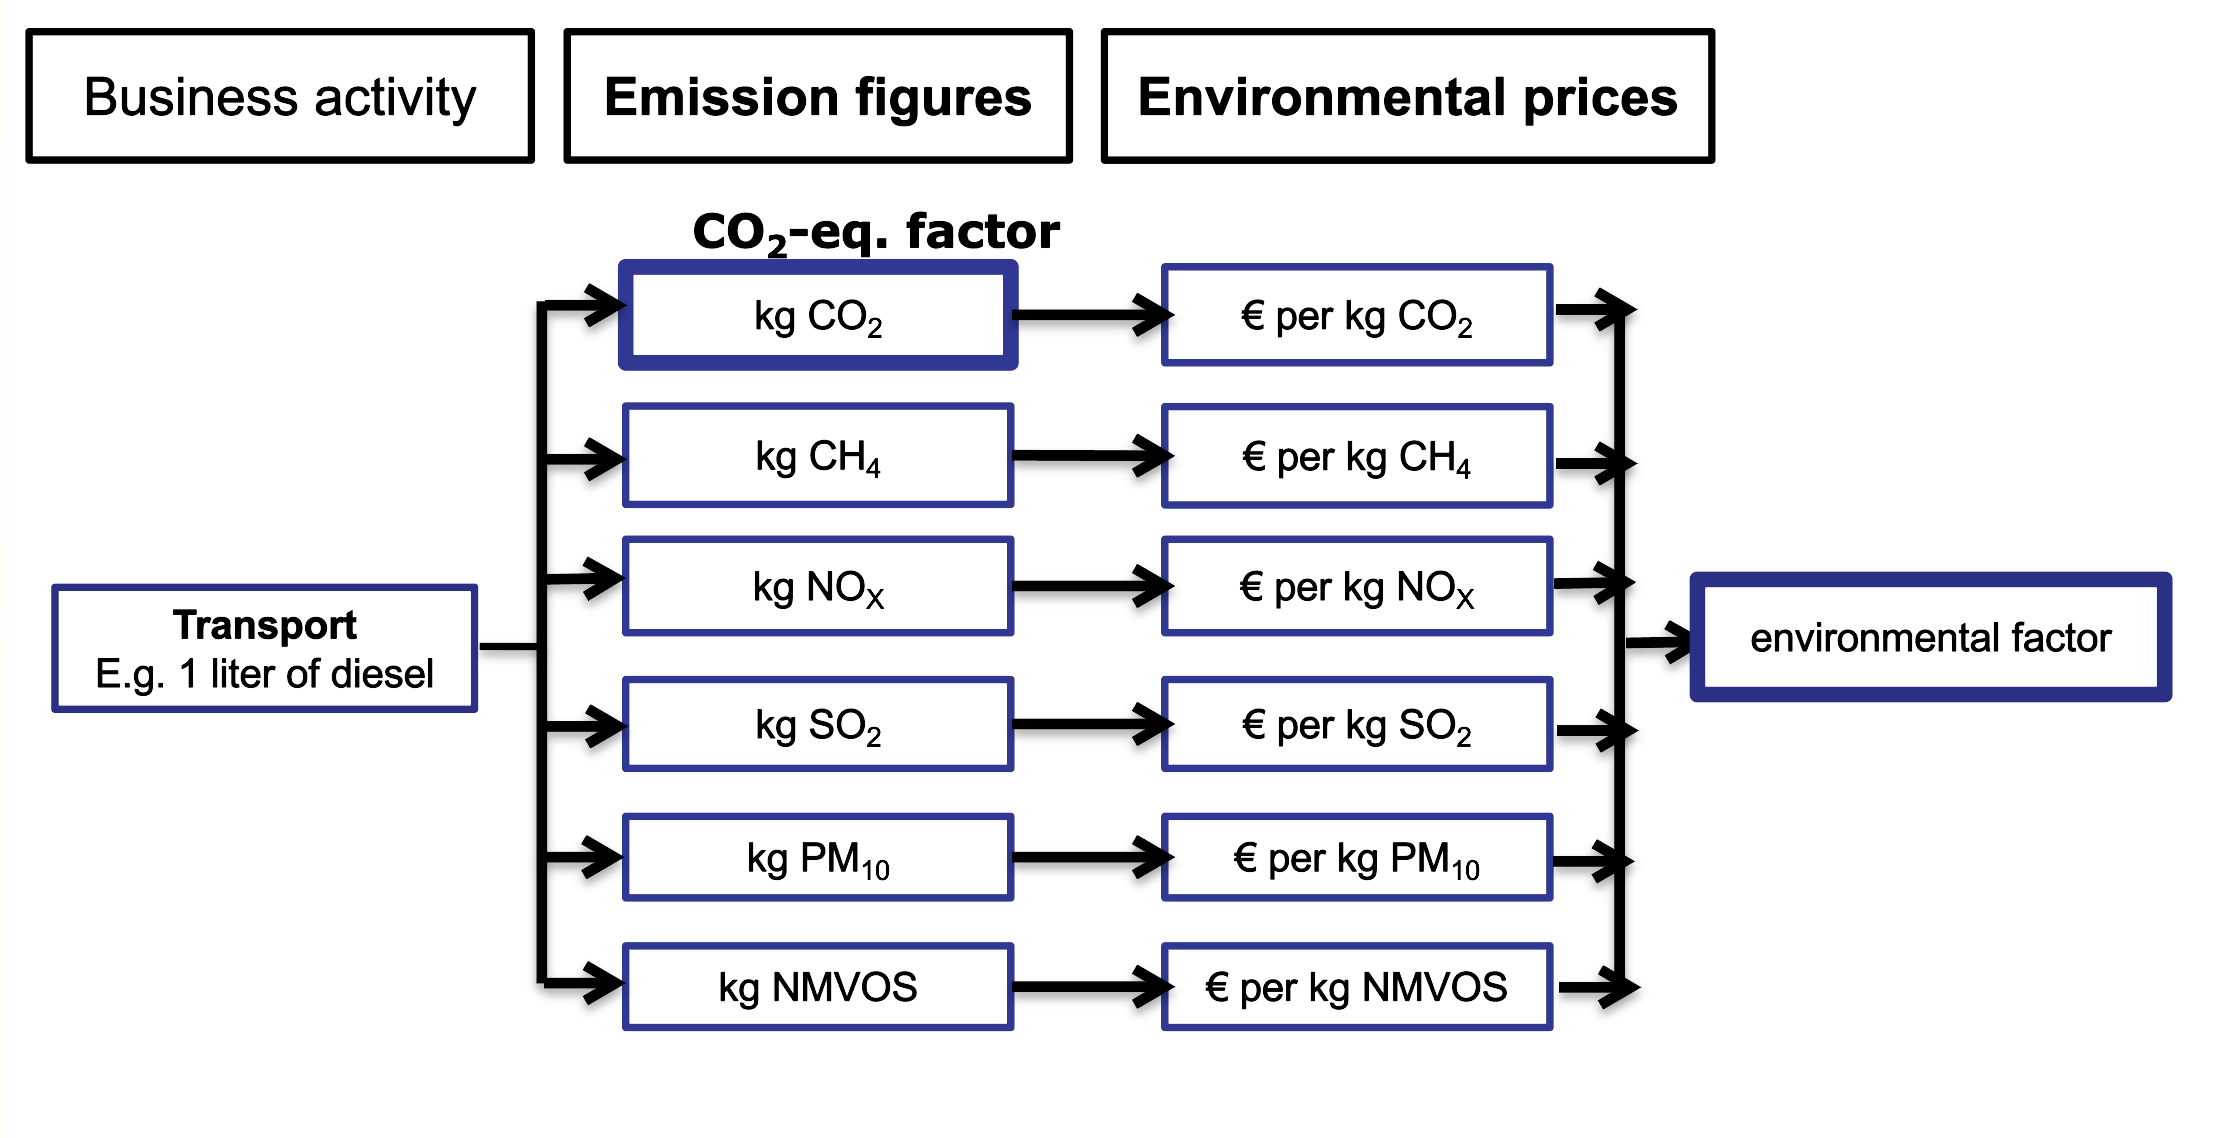
Environmental factors are therefore determined on the basis of emission figures and environmental prices. The graphs in the Environmental Barometer therefore reflect the environmental score in your barometer based on your entered business activities (kWh of electricity, liters of diesel, kg of plastic waste, etc.).
It is important to remember that the environmental graph is based on multiple environmental effects and therefore shows the big picture of your environmental impact. Your CO₂ graph is based only on the effect of greenhouse gases (CO₂, CH₄, refrigerants, etc.). The CO₂ factor takes together the greenhouse effect of all greenhouse gases.
Environmental score
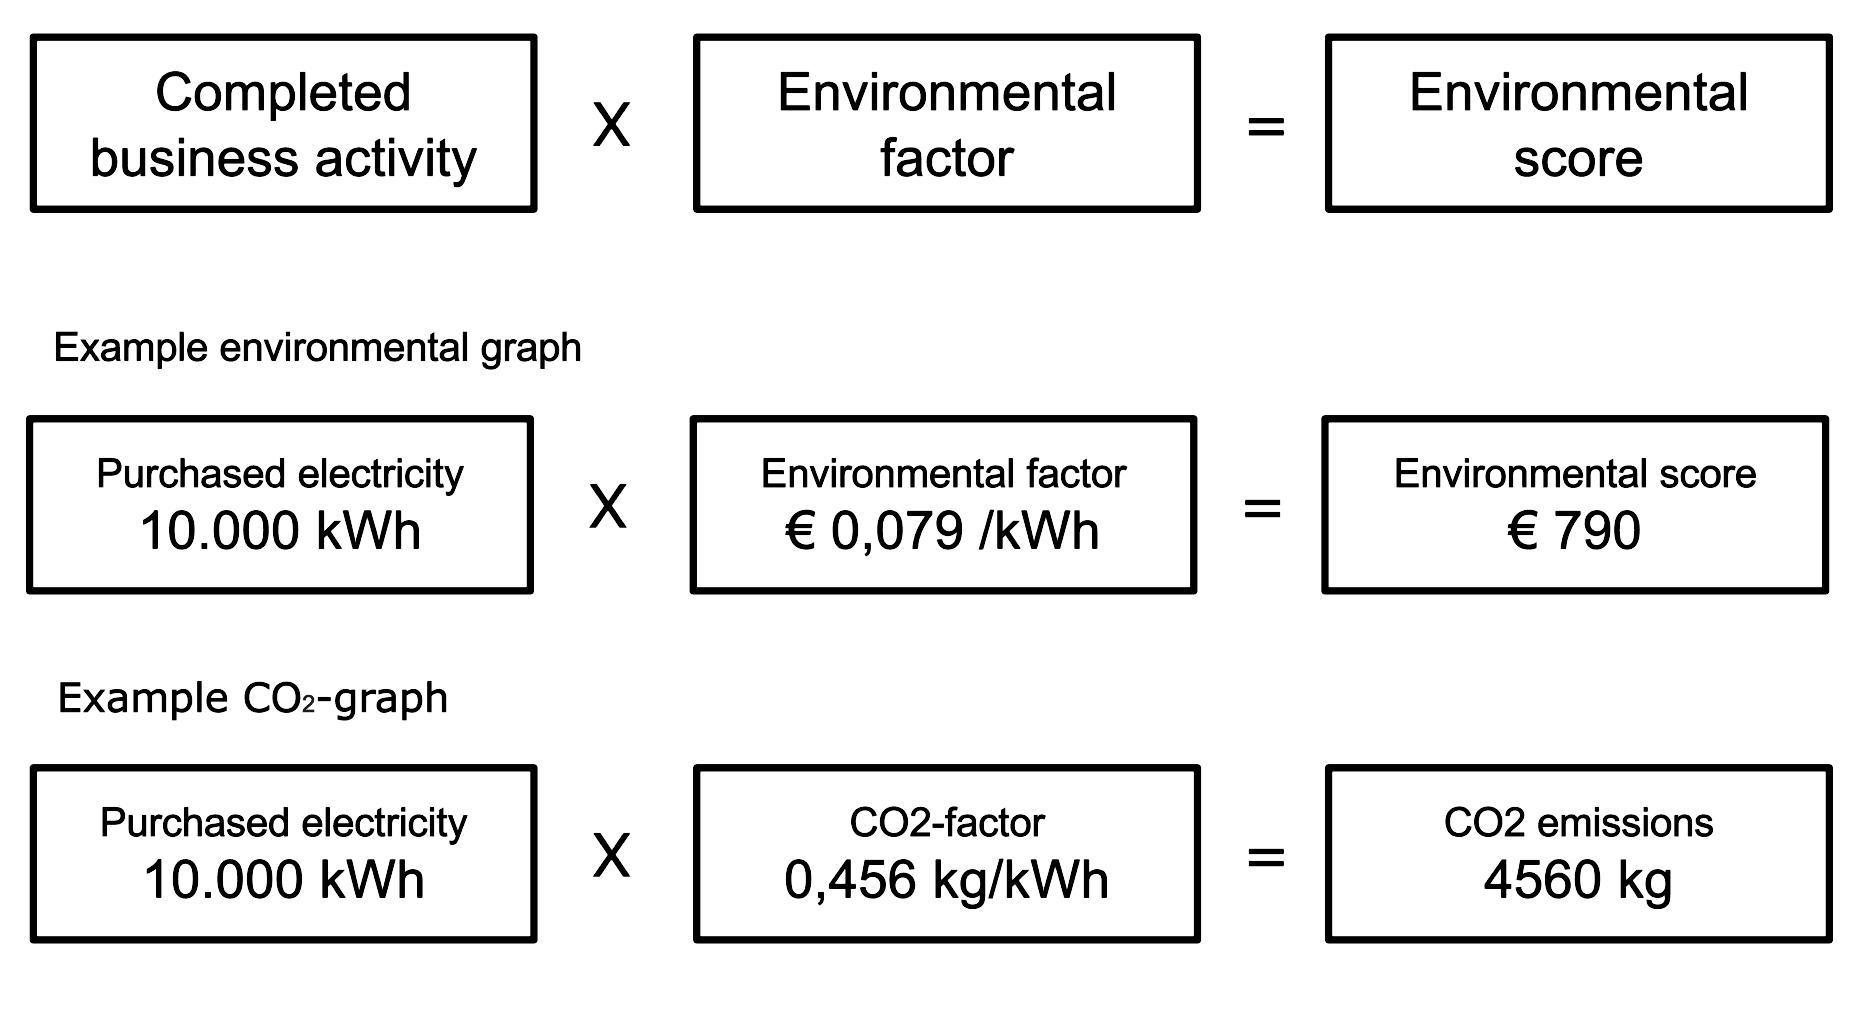
Environmental factors ensure that completed business activities receive a certain environmental score in the environmental graph and CO₂ graph. The environmental score is expressed in euros for the environmental graph and kg of CO₂ emissions for the CO₂ graph. However, this is reflected in your graph in percentages based on the ratio of the business activities entered.
When updating the environmental factors in 2024, we will calculate the new environmental factors in the barometer by applying the new environmental prices to the existing emission factors (which may differ per year). The environmental factor of a business activity is therefore not the same for all years.
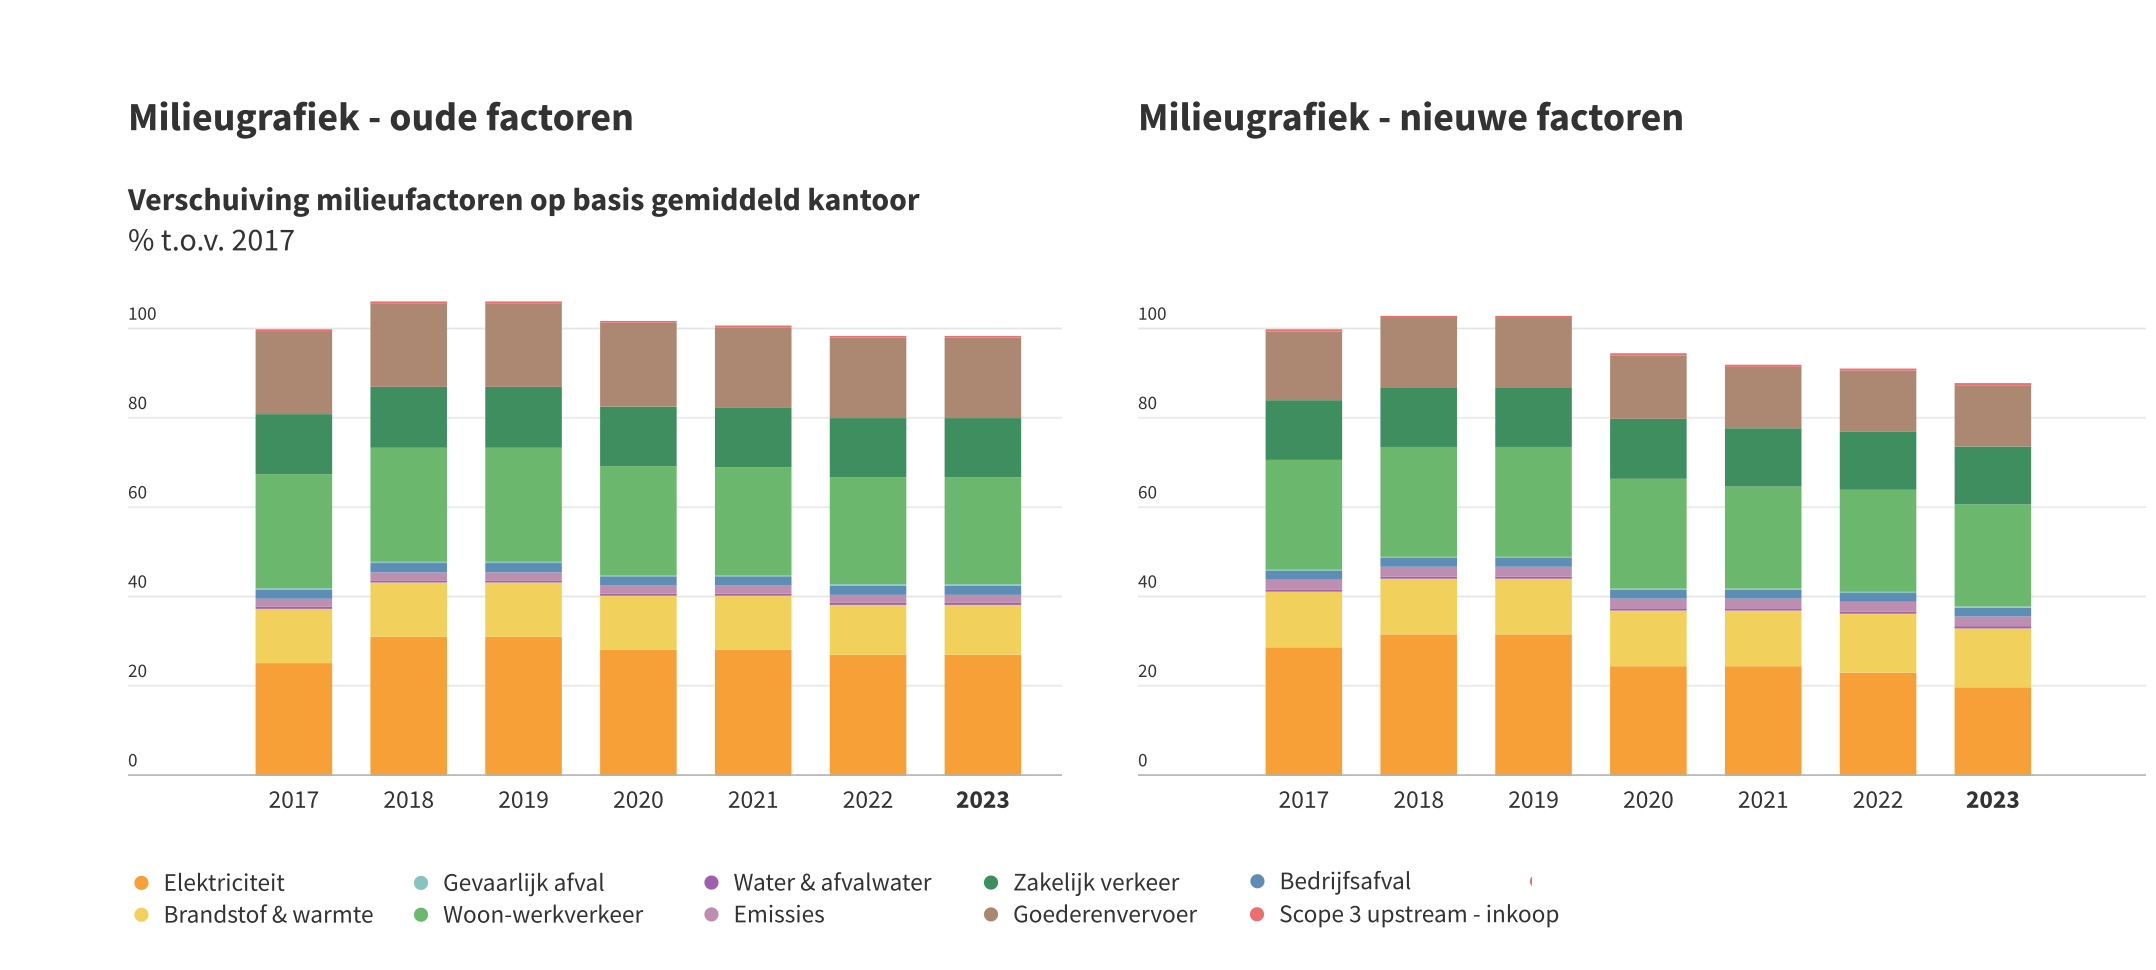
This example is based on the same data entered for each year in the business activities for both situations. The small shifts are therefore caused by the new environmental factors. You see a bigger shift with electricity, which we explain later in this article.
An overview of important changes
Below is a list of the changes in the environmental price of the five substances that have the most impact on the environmental graph. The price change per substance varies considerably.
- CO₂ +38% (from €0.094 to €0.13)
- NOₓ -14% (€34.70 to €29.90)
- SO₂ +131% (€24.90 to €57.50)
- NMVOC +30% (€ 2.10 to € 2.73)
- PM10 +55% (€44.60 to €69.00)
The Envirometer update of environmental prices is not only based on last year’s CE report. The Environmental Barometer uses a different methodology for the environmental price of waste, based on the recycling percentage of separated waste flows. The environmental price of a kg of non-recyclable waste has been adjusted for inflation over the years since the last environmental price update: 23%.
Based on these increases, it may seem as if PM10 (particulate matter) emissions dominate the environmental factor due to the high price per kg, but many more kg of CO₂ are emitted than kg of PM10, meaning that CO₂ emissions are still a significant factor for most business activities. constitutes a large part of the environmental factor.
Influence on environmental prices
Due to the combination of emissions, the effect of the environmental price change on the environmental factor differs per theme. Many environmental factors are increasing, but some much more than others and some are decreasing. The effect of the environmental price change is a shift in the impact of various activities. However, this appears to be quite small in recent years.
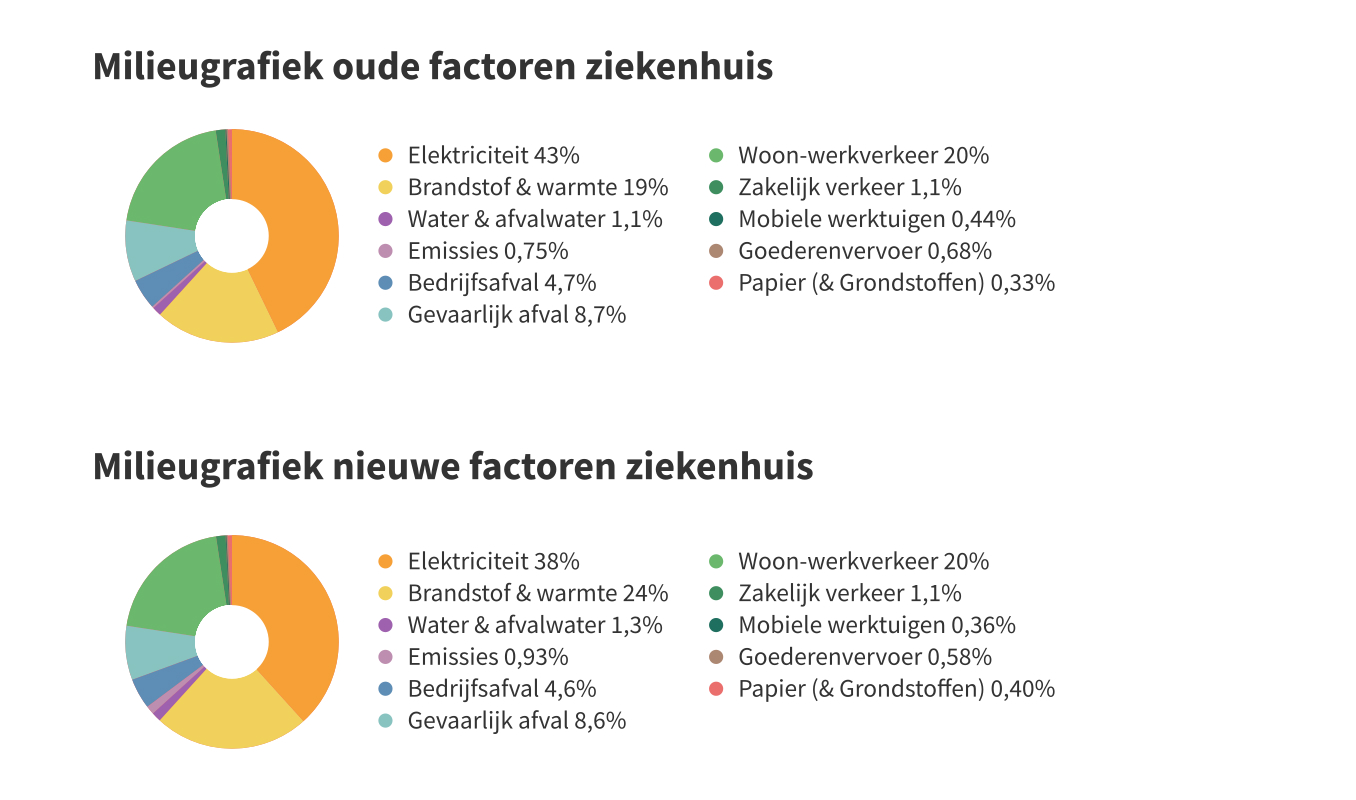
The relationship between the environmental impact of the themes of electricity, fuel & heat and transport themes has only changed slightly, as you can see in the example above. The shift may be somewhat greater for your company depending on your business activities. This example is based on the same year with the same completed business activities.
Declining electricity emissions
Pollutant emissions from electricity have fallen sharply over the years. We see a bigger difference with this update because the emission factors (NOₓ, Particulate Matter, NMVOC) of electricity have been adjusted retroactively. We have decided to spread this decrease in pollutant emissions between 2017 and 2024 over this entire period. The CO₂ emission factors also count in the environmental score, but they have already been regularly updated.
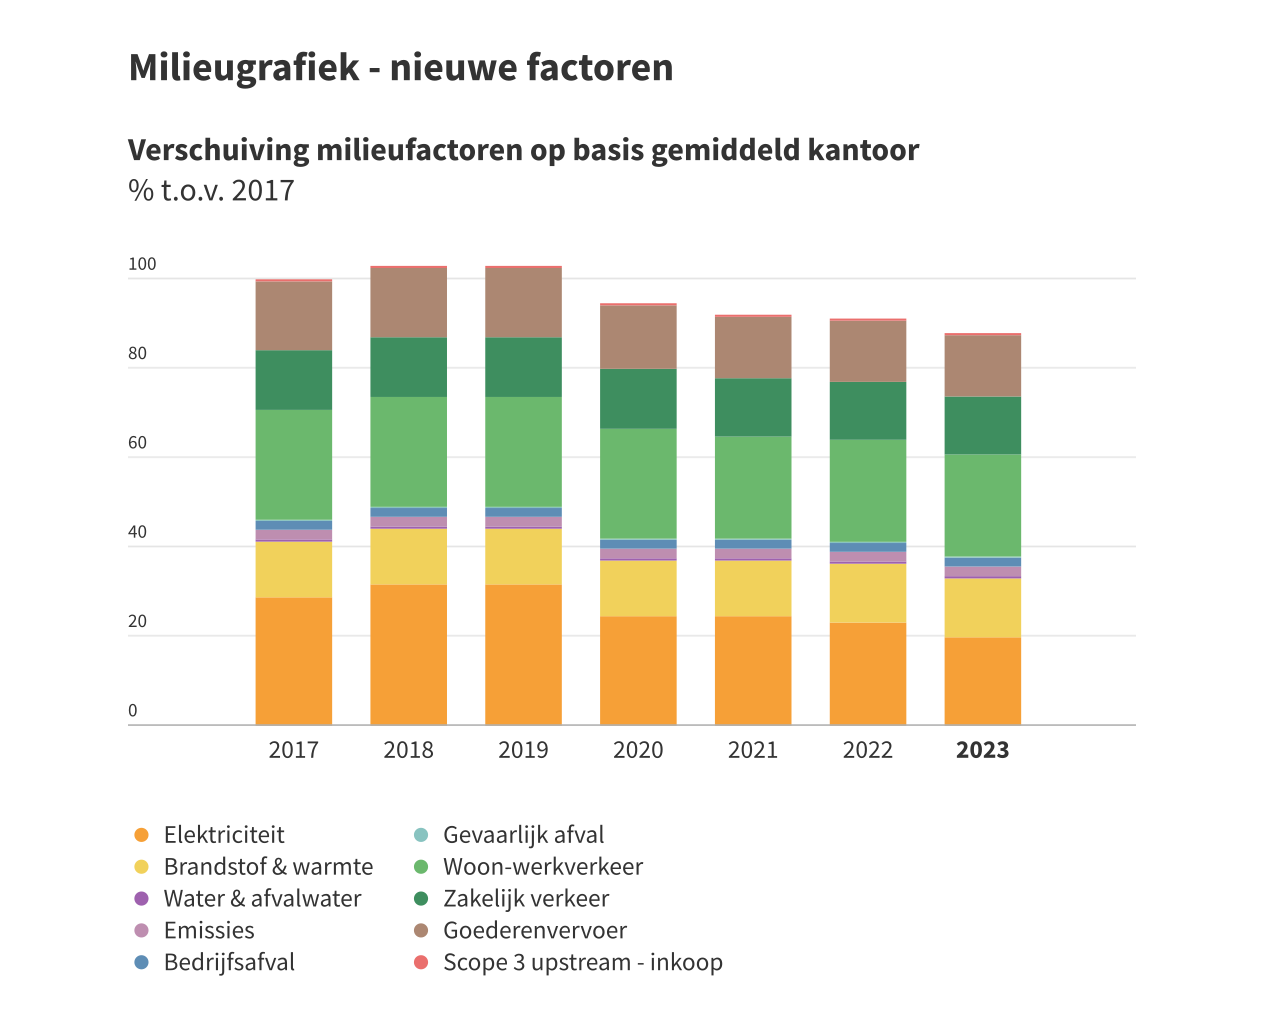
The effect of this adjustment on electricity is visible in the attached graph, which assumes the same quantities entered. For electricity, we have not gone back further than 2017 with the environmental prices, the date of the previous environmental prices update.
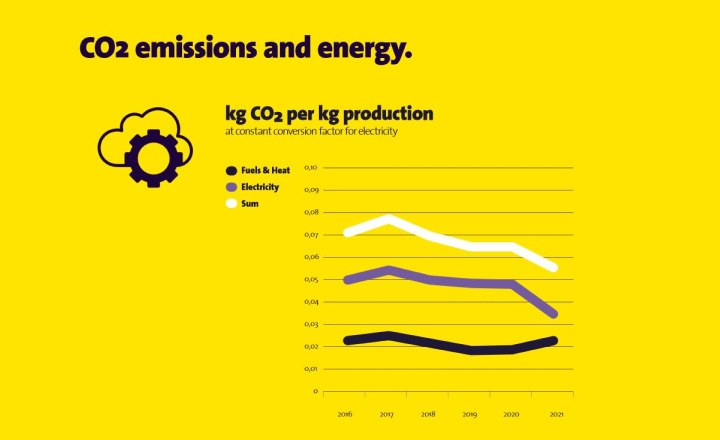
With the Envirometer, the English version of the Miliebarometer, Zeelandia can retrieve environmental data from their international branches for a full CSR report.

This year, the new environmental prices that CE Delft published in 2023 have been implemented in the Envirometer. This way we ensure that the tool remains up to date with developments in science and politics. But why is this important? And what exactly are the environmental prices?

The annual update of the CO₂ emission factors took place on January 22, 2024 www.co2emissionsfactors.nl. All changes were implemented in the Envirometer on February 5. It is useful for Milieubarometer users to know the most important changes.