Monitoring and making adjustments
Have you been reducing your impact? By taking stock each year you can quickly see where adjustments need to be made in your business operations.
Take stock each year
Have you succeeded in reducing the impact of your company or organisation? By taking stock each year you can quickly see where adjustments need to be made in your business operations.
These are the steps you need to take:
- Enter your data from the previous calendar year in the Envirometer.
- Analyse the results shown in the data visuals.
- Fine tune your action list if you do not see a (sufficient) reduction in impact.
- Share the results in your company or organisation.
See your progress towards your targets
Multi-year data visuals for emissions and environmental impact
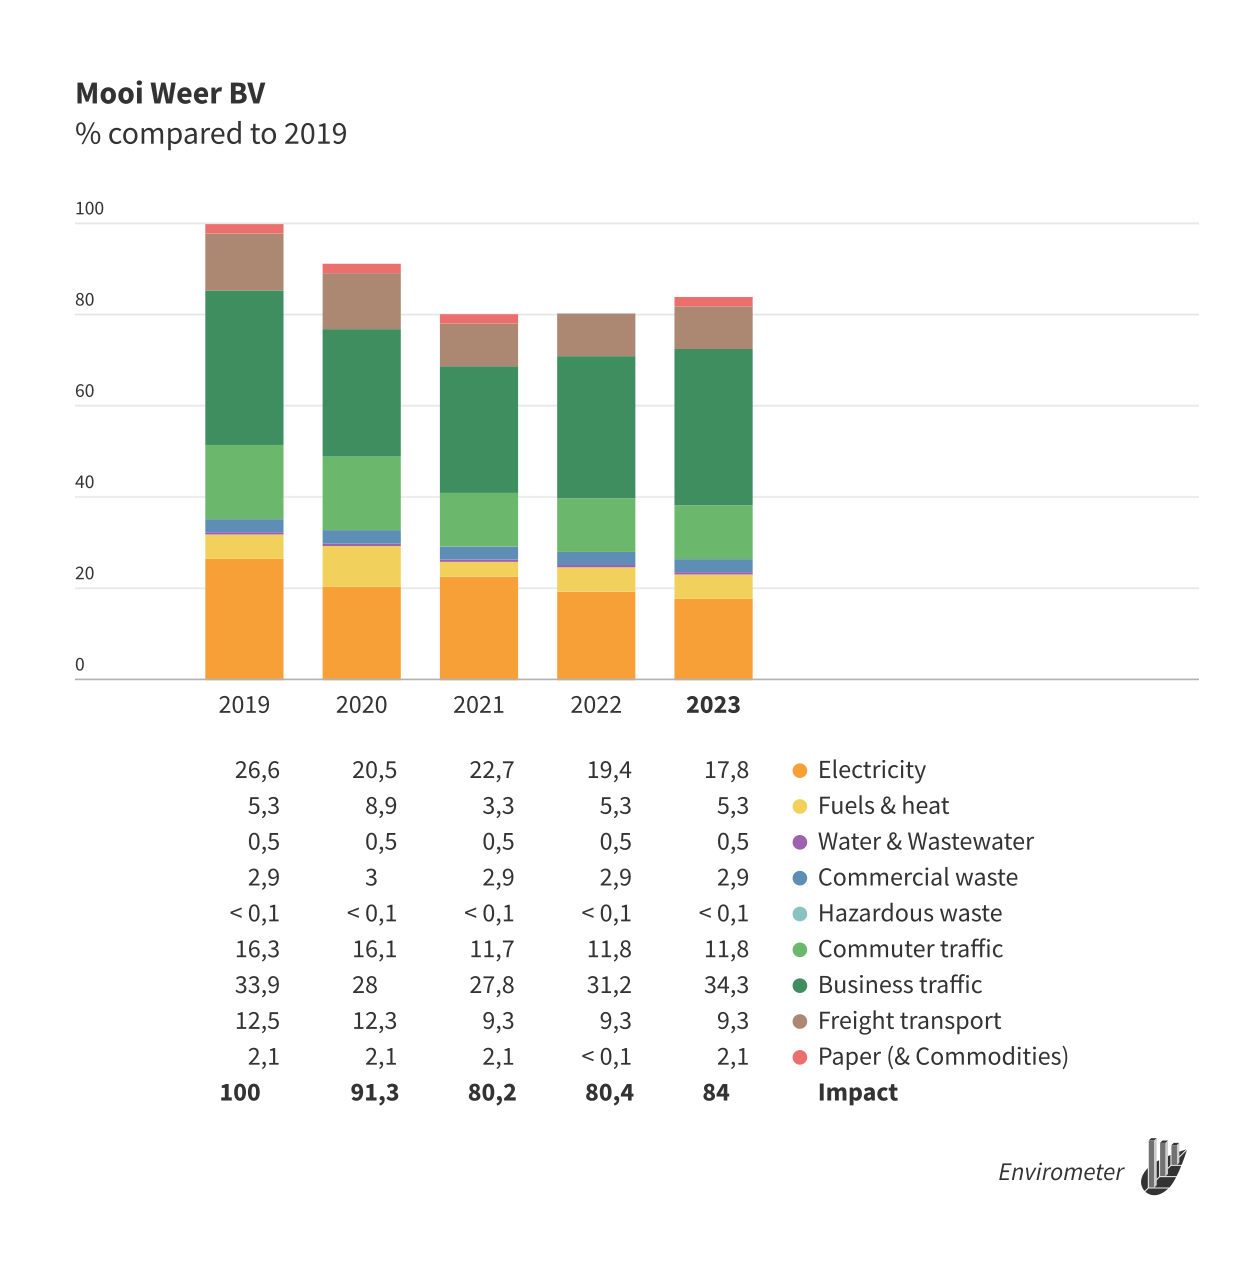
In the multi-year data visuals for emissions or environmental impact you can quickly see whether there is a downward trend. You can zoom in per activity, which enables you to quickly see where you need to make adjustments. As well as adding each new year, you can also add more years further back to extend the line further into the past.
Goal-line charts with traffic light colours
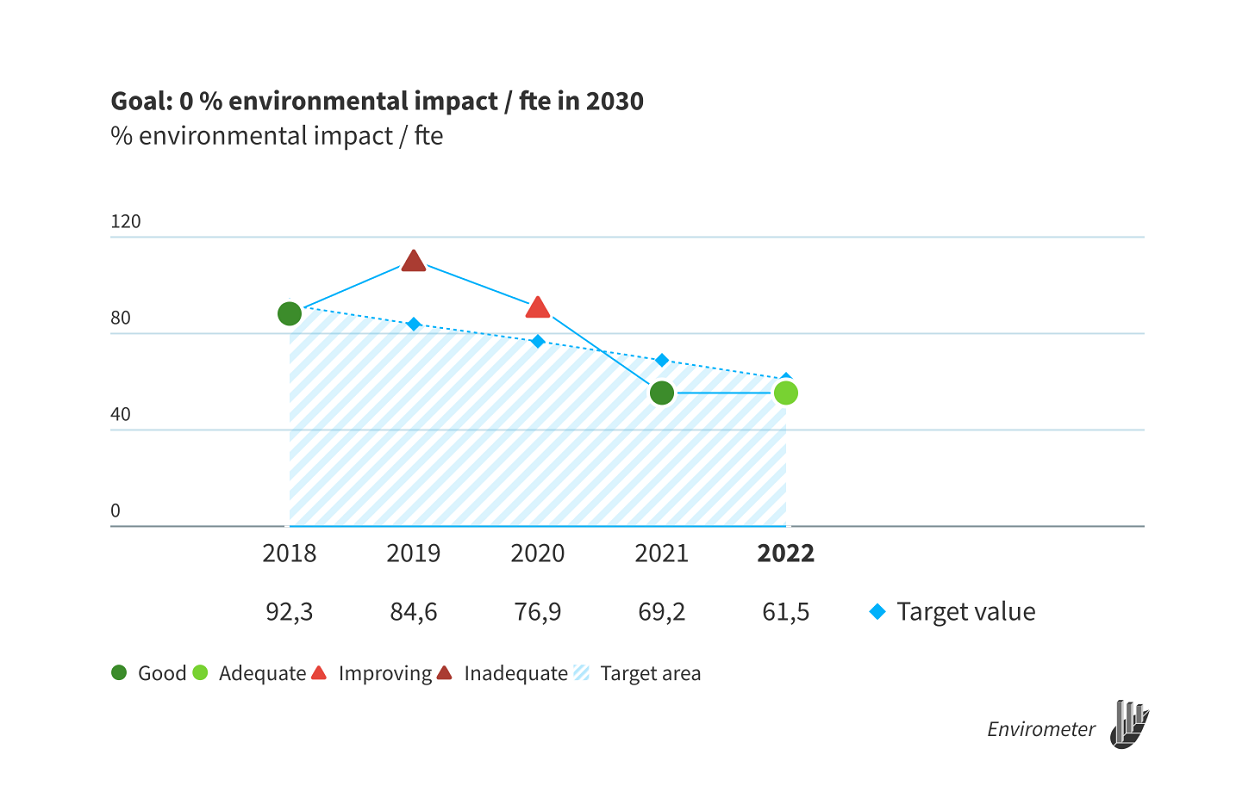
After entering your data, your progress will be visualised in goal-line charts.
Dashboard of your sustainability target results
Target dashboard
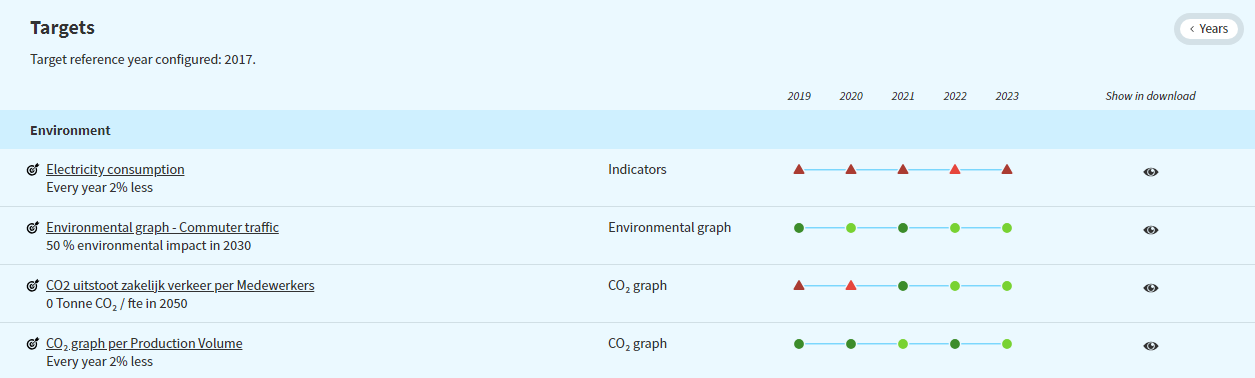
The target dashboard shows all scores for all targets set. The traffic light colours visualise whether you are achieving your ambitions. You are free to adjust the layout, order and accompanying information for your targets however you like.
Ready for the next step?
Getting started with: Internal and external communication
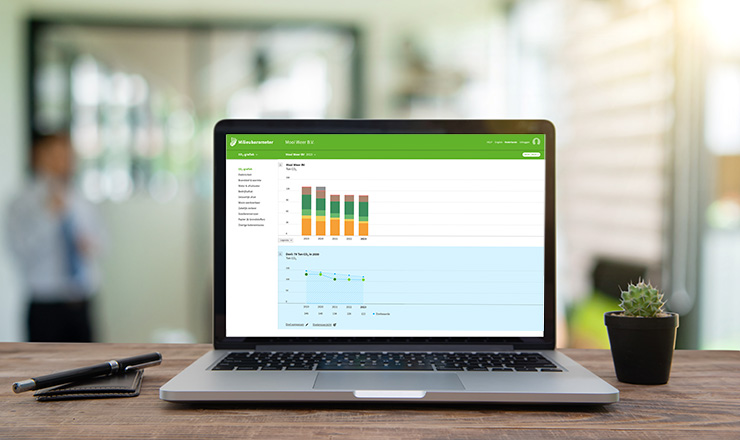
Get started with the Envirometer
Want to get started immediately? No problem! Take out a subscription today and get started by filling in your details.

I entered all my data in the Envirometer again this year. The reporting module is a valuable improvement to the tool; it looks great!
Frequently asked questions
Looking for an answer and your question is not listed? Then take a look at our FAQ overviewpage
-
Can I compare my CO₂ footprint with that of other organizations?
-
If a sector average is available for your industry in the Envirometer, you can compare both key figures and the CO₂ and environmental graphs with your industry.
Outside the Envirometer, you can also compare your CO₂ footprint with organizations that have made their CO₂ footprints public. See the page with public CO₂ footprints.
-
Can I enter previous years?
-
Yes, you can add as many years to the Envirometer as needed. There is no maximum; you can always enter and adjust figures.